Home
Language Blog
Language Intervention Products
Language Therapy
Language eBook
Language program
Inferencing
Language skills
Shared Reading
Best Resources
Information about Language Assessment
Commentary
Free Activities
What is language?
Language Disorder
Working Memory
Tips for Parents
Advanced Lang
Sentences
Speech What is Speech?
Speech Errors
Speech Structures
Dyspraxia
Acronyms
Reading Disorder Inference Program
Inference-Reading
Vocab Activities
Vocabulary Comp
Comprehension
Dyslexia Defined
Literacy
Phonological A
Social Language Autism
Asperger's Syn
Figurative lang
Pragmatic lang
Best Books Information Book Activities
Benefits...
Best books
1st Grade Books
3rd Grade Books
6th Grade Books
Textbooks
Website Information My Website
Contact Me
Research Articles
About Me
Privacy Policy
Information for Teachers and Speechies Teacher Tips
Board Games
Grammar
Links
Classroom lang

[?] Subscribe To This Site

XML RSS
Add to Google
Add to My Yahoo!
Add to My MSN
Subscribe with Bloglines


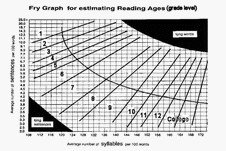
How to use the Fry Readability Graph.


The Fry Readability Graph is perhaps the best known of the readability measures available.


It's a very handy tool because it helps the teacher or speech-language pathologist to determine at which reading level a particular text is.


For instance, the storybook "Belinda" by Pamela Allen, is a grade 2 level text (year 3). We can predict, to some degree of accuracy, which grade level to target "Belinda" because of the reasonable reliability of the graph.


Of course, as stated elsewhere on this site, the most reliable measure of a text's level is for the student to read the story and the clinician then notes the level of difficulty.


The graph helps us to at least move in the right direction.


It's very useful for this fact alone.


Directions for use


1) The clinician selects three 100 word passages from the target storybook.


2) The number of sentences in each 100 word passage are counted - start at the beginning of a sentence.


3) The number of syllables in each 100 word passage are counted - (option) photocopy text and mark each syllable.


4) Average the three sets of numbers for both sentences and syllables (Add three sets together, divide by 3, etc)


5) Use the average from the syllable data and plot on the horizontal (across) axis of the graph.


6) Use the average from the sentence data and plot on the vertical (up) axis of the graph.


7) The point where the two numbers correspond or meet, represents the readability level of the text.


Follow this link for an example and a print out of a Fry graph


Also, please sign up for the Language Dispatch newsletter. The newsletter provides essential monthly language intervention tips, techniques and information.


The information provided in the monthly newsletters is ideally suited to be used by speech-language pathologists, teachers and parents of language impaired students.


Once you've signed up to the Language Dispatch you'll also receive a new free Idioms ebook, On Cloud Nine.


The On Cloud Nine Program features 100 context based scenarios, and a multiple choice format to effectively teach this difficult figurative language concept.


The program is very easy to use and is yours free, once you've signed up to the Language Dispatch. The program is available as an Adobe pdf download.

Enter your E-mail Address
Enter your First Name (optional)
Then

Don't worry -- your e-mail address is totally secure.
I promise to use it only to send you The Language Dispatch.

Return from Fry Readability Graph to Picture Book Activities